
Skip to the good bit
ToggleTrading the financial markets can be a complex journey, but understanding candlestick patterns like the inverted hammer can provide valuable insights into potential trend reversals. Whether you’re trading stocks, forex, or crypto, recognizing this pattern can help you make informed decisions. This guide breaks down the inverted hammer, its significance, and how beginners can use it effectively in their trading strategies.
What is an Inverted Hammer Candlestick?
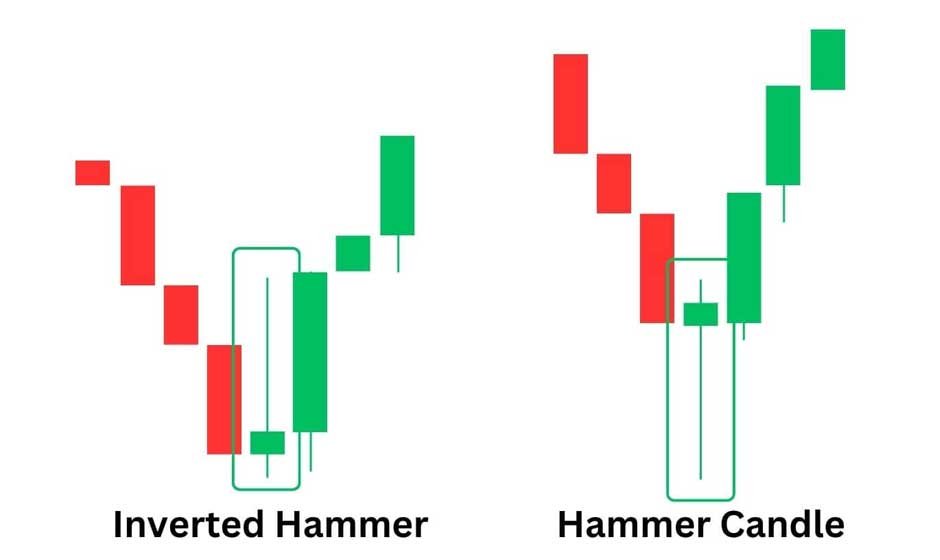
The inverted hammer candlestick is a single-candle pattern that occurs at the bottom of a downtrend, signaling a potential bullish reversal. Its unique shape resembles an upside-down hammer:
- Small real body: The small rectangular part indicates a minor difference between the opening and closing prices.
- Long upper shadow: Represents significant buying pressure during the trading session.
- Little to no lower shadow: Indicates a rejection of lower prices.
This pattern often hints that sellers are losing control, and buyers may soon take charge.
How to Identify an Inverted Hammer Pattern
To spot an inverted hammer, look for these characteristics:
- Location in the Trend: The pattern must appear at the bottom of a downtrend or after a series of bearish candles.
- Shadow and Body Ratio: The upper shadow should be at least twice the size of the real body.
- Volume Confirmation: A spike in trading volume can strengthen the validity of the pattern.
For example, if a stock price has been declining steadily and an inverted hammer forms with a noticeable increase in volume, it could signal a shift in market sentiment. Platforms like Alchemy Markets provide advanced charting tools and real-time data, helping traders quickly identify such patterns and assess their reliability for potential reversals
Why is the Inverted Hammer Important?
The inverted hammer provides early signs of a potential reversal, giving traders an opportunity to prepare for a bullish move. Here’s why it’s valuable:
- Reversal Signal: Indicates weakening selling pressure and a possible uptrend.
- Risk Management: Helps traders set stop-loss levels below the candle’s low.
- Universal Application: Works across multiple markets, including stocks, forex, and cryptocurrencies.
How to Use the Inverted Hammer in a Trading Strategy
While the inverted hammer is a reliable indicator, it works best when combined with other tools like technical indicators, support and resistance levels, and volume analysis. Follow these steps to incorporate it into your strategy:
1. Confirm the Pattern
Wait for the next candle to close above the inverted hammer’s high. This confirmation suggests the start of an upward trend.
2. Combine with Indicators
Pair the pattern with indicators like:
- Relative Strength Index (RSI): Look for oversold conditions.
- Moving Averages: Ensure the price is near a key support level.
3. Set Entry and Exit Points
- Entry: Place a buy order above the high of the inverted hammer.
- Stop-Loss: Set a stop-loss below the pattern’s low.
- Take-Profit: Use a risk-reward ratio, such as 1:2 or 1:3, to lock in profits.
Inverted Hammer vs. Shooting Star: Key Differences
It’s easy to confuse the inverted hammer with the shooting star, but they signal opposite trends:
| Inverted Hammer | Shooting Star |
| Appears at the bottom of a downtrend | Appears at the top of an uptrend |
| Signals a potential bullish reversal | Signals a potential bearish reversal |
| Long upper shadow, small body | Long upper shadow, small body |
Knowing the difference ensures accurate analysis and avoids trading errors.
Common Mistakes When Trading the Inverted Hammer
Beginner traders often make these mistakes:
- Ignoring Confirmation: Acting without waiting for the next candle to confirm the reversal.
- Overlooking Volume: Low volume reduces the pattern’s reliability.
- Skipping Context: Failing to consider the overall market trend and nearby support levels.
Avoid these errors to improve your success rate.
Conclusion
The inverted hammer candlestick pattern is a powerful tool for identifying potential reversals in bearish trends. While simple to understand, its effectiveness increases with other technical analysis tools and market context. By mastering this pattern, beginners can make more confident and informed trading decisions.
Start practicing this strategy in a demo account and gradually implement it into your trading plan for better results, especially when combining it with techniques learned from an Elliott Wave Course to identify broader market trends and key reversal points.
FAQs About the Inverted Hammer Pattern
1. Can the inverted hammer appear in an uptrend?
No, the inverted hammer is primarily a bullish reversal pattern and appears at the bottom of a downtrend. If it occurs during an uptrend, it’s not valid.
2. Is the inverted hammer reliable on its own?
While it’s a strong indicator, relying solely on the inverted hammer without additional confirmation can lead to false signals.
3. What timeframes work best for trading the inverted hammer?
The pattern works well on all timeframes, but it’s most effective on daily or higher timeframes due to reduced noise.